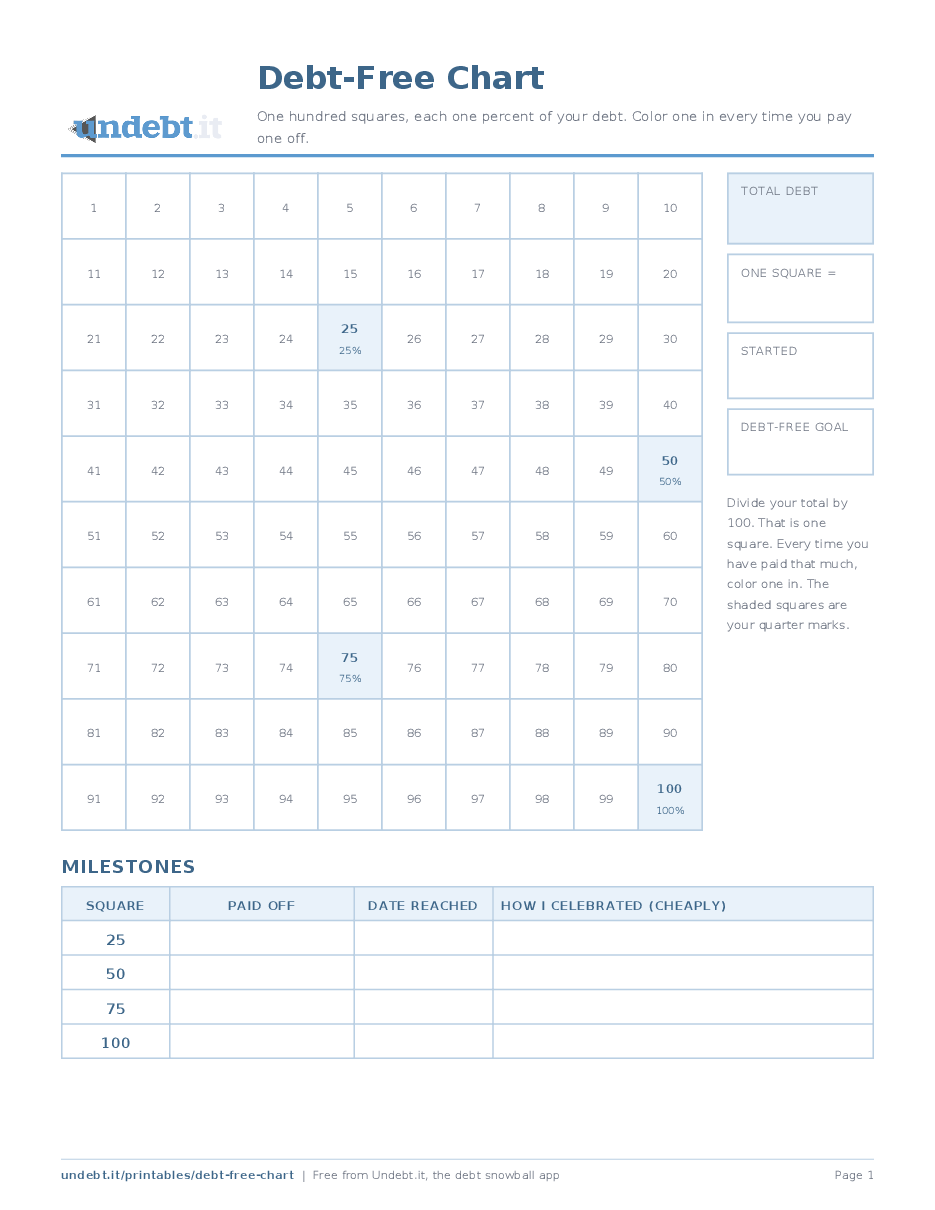
One hundred squares, each one percent of your debt. Color one in every time you pay one off.
A hundred squares, ten across and ten down. Each square is one percent of your total debt. Every time you have paid off that much, you color one in. That is the entire system, and it has probably got more people out of debt than any spreadsheet ever built.
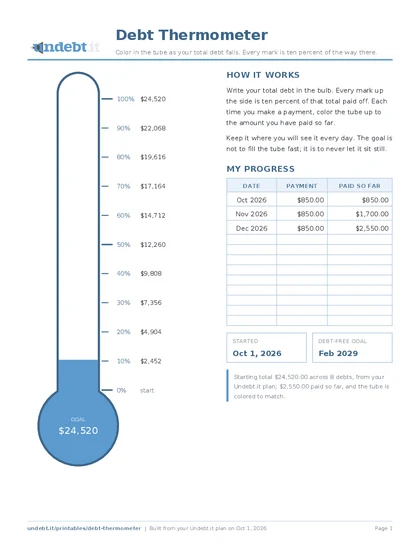
The chart works for the same reason the thermometer does, with one difference: a square is a smaller step than a ten percent mark, so on a large debt you get something to color in every month or two instead of every year. The quarter marks at 25, 50, 75 and 100 are shaded so the milestones stand out, and there is a small table below to record when you reached each one and how you celebrated.
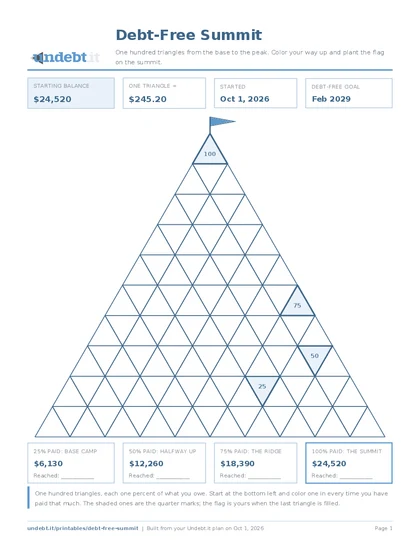
Divide your total by 100 to get the value of one square and write it in the box. Then it is just paying, coloring and watching the grid fill. Numbered squares mean you can also color in order and read your progress as a percentage at a glance. Prefer something with more shape to color? The Debt-Free Summit is the same hundred steps drawn as a mountain of triangles, colored from the base up to a flag.
Download the free PDF
Free, no signup, no email address. Pick your paper size; every version is one page and prints on any home printer.
The ink saver version is the same sheet in black and gray for cheap printing. Print at 100 percent, not "fit to page", so the rows stay a comfortable height for handwriting.
Rather have the numbers filled in for you? Undebt.it members can open Printables in the member menu and get this sheet built from their own plan. A free Undebt.it account is all it takes.
What it looks like filled in
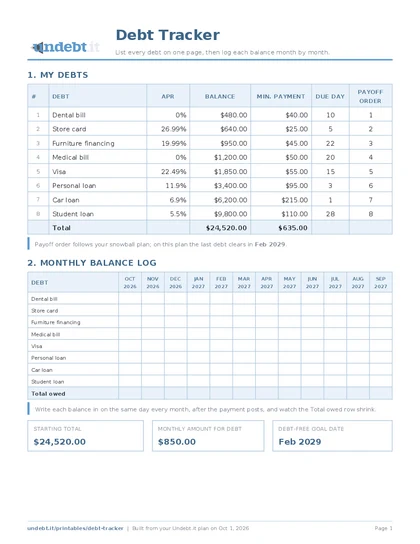
The same sheet completed with a sample plan: eight made-up debts totalling $24,520, paid down at $850 a month in snowball order. Demo numbers, just enough to show how the page is meant to be used.
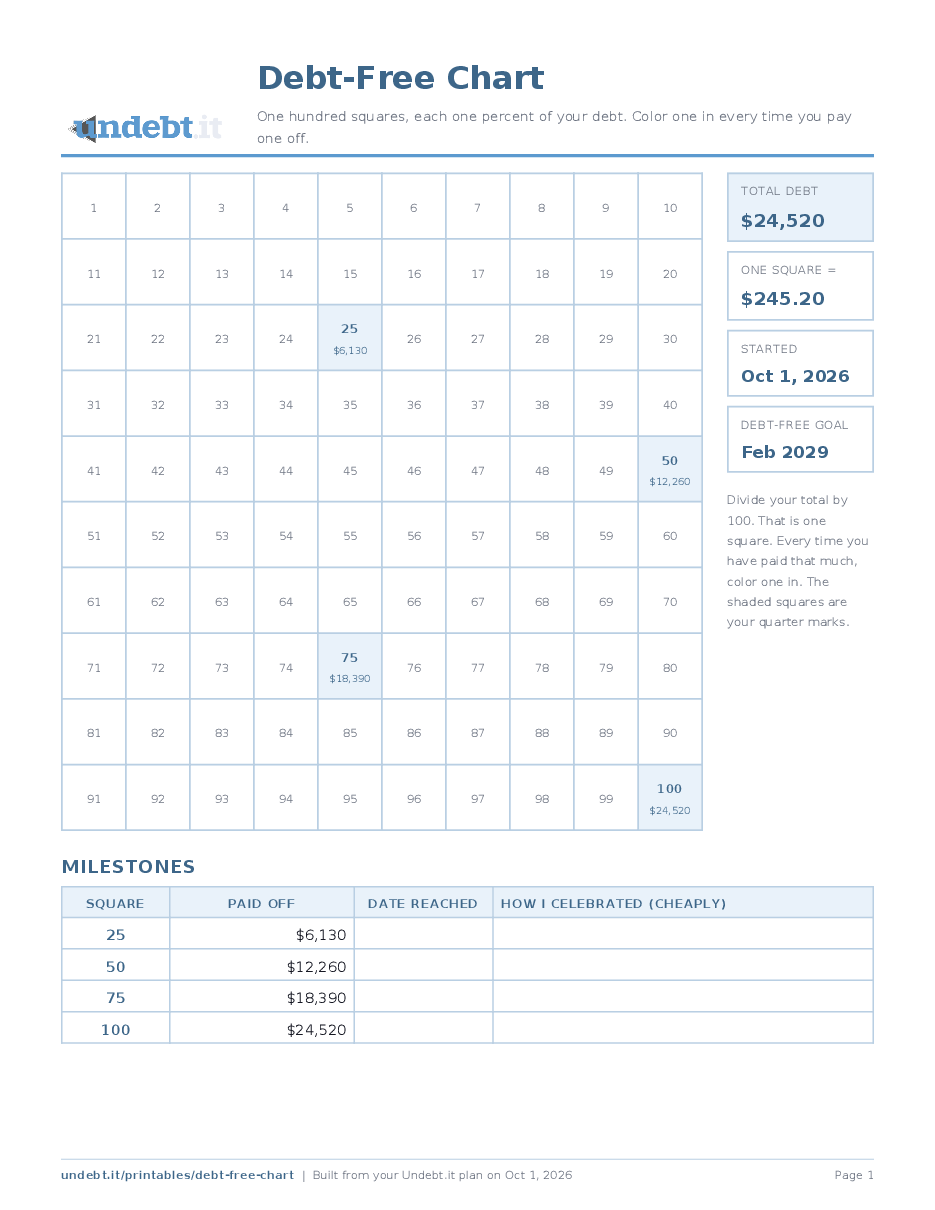
Open the filled-in example as a PDF. The download buttons above give you the blank sheet.
How to use it
- Write your total debt in the box at the top right. Add up every balance; the debt tracker makes that easy.
- Divide by 100 and write the answer in the "one square =" box. On a $19,690 debt, that is $196.90 a square.
- Color a square each time your total paid grows by that amount. Keep a running total of payments on the back of the sheet or on the payment log.
- Mark the milestones. When you color square 25, 50, 75 and 100, write the date in the table and do something small to mark it.
Tips that make it stick
- Color the squares in order, 1 to 100.The number on the last colored square is your percentage done.
- Put it where the household sees it.Children in particular love being allowed to color the next square.
- A big debt means each square is worth a lot.If months go by without a square, make a second chart for one small debt so there is always something to color.